Spending visualization
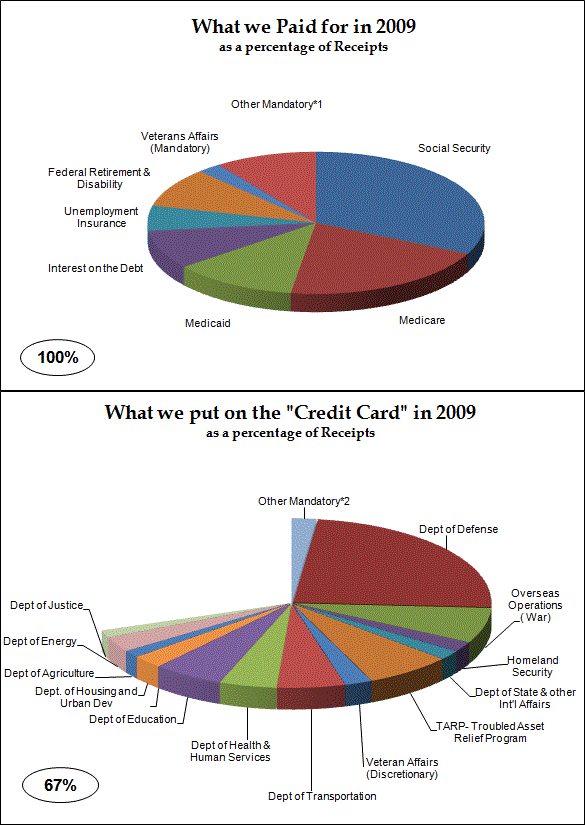
The saying goes, a picture is worth a thousand words. Â I have to agree. Â So, here are a couple of charts to break down our spending.
In 2009 our Outlays were 167% of our Receipts.
Most people that I talk to say “Stop spending all the money on war and there will be plenty”. Â I try to explain that it might have been a valid argument at one time, but not any more.
So here it is, lets cut all the overseas operations (War) to ZERO. While we are at it,….Lets declare world peace…, lets cut the entire Department of Defense to ZERO!  Please note…we are still WAY OVERSPENDING!
I have looked at these numbers long and hard, but don’t see an easy way to balance this.
In the event that you conclude that I simply must have made a mistake somewhere, here is the President’s budget.  There are a series of tables on pages 146, 151, and173-175 that have the various pieces of information I used.  Other Mandatory includes refundable earned income credits, refundable dependent child credits, family services and other small items that are designated as mandatory, not discretionary.
